

Vision Pro C
Description
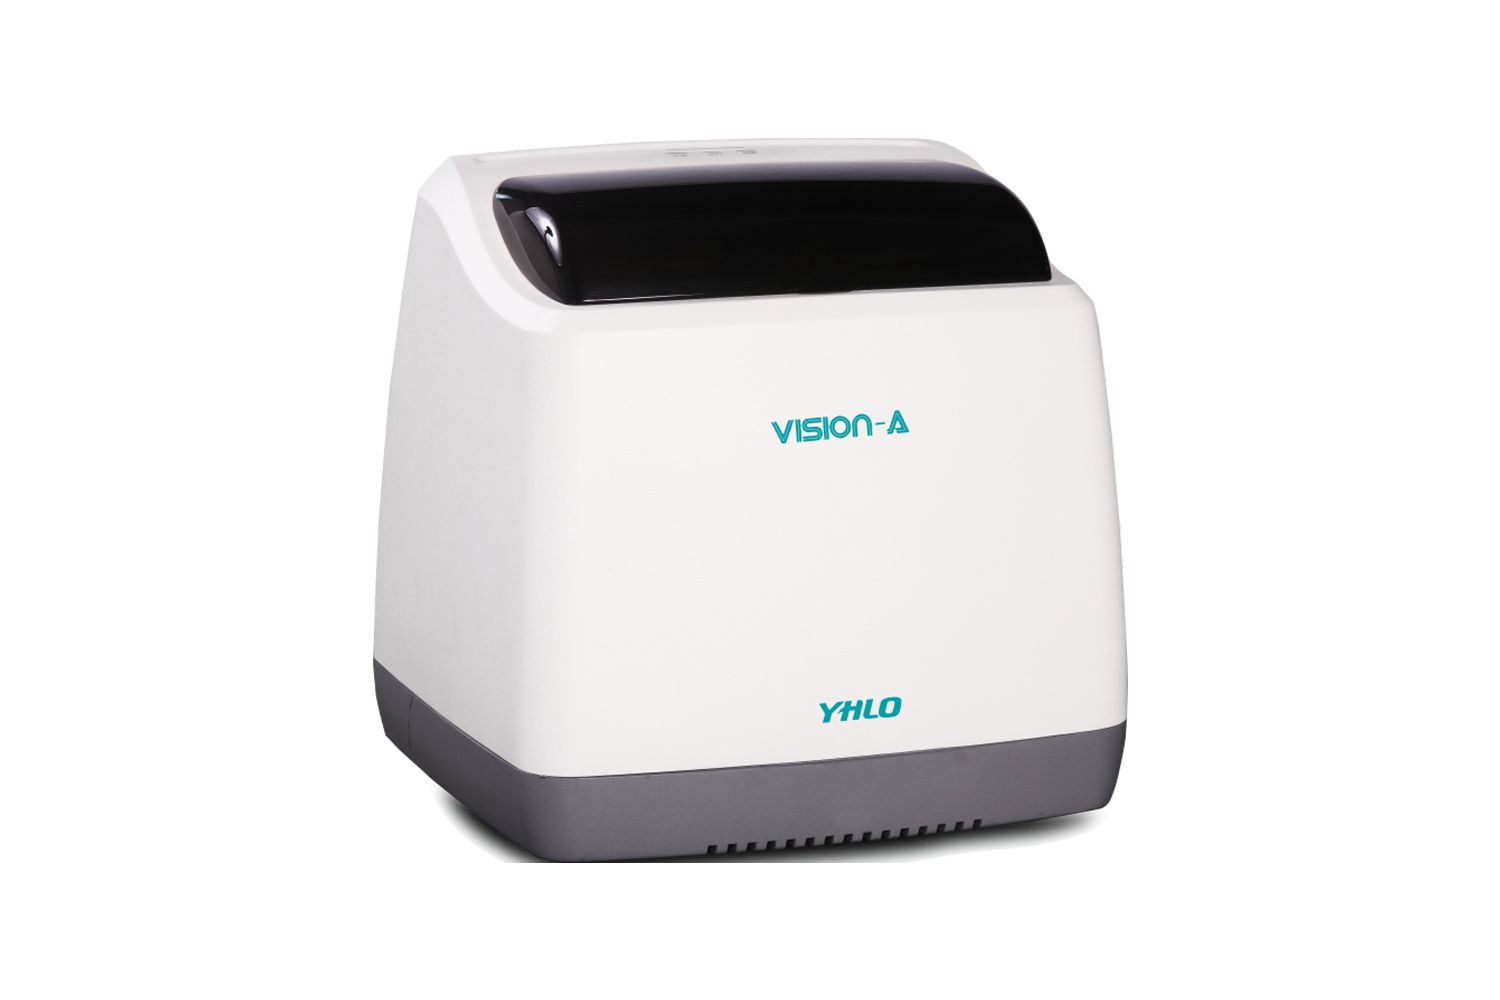
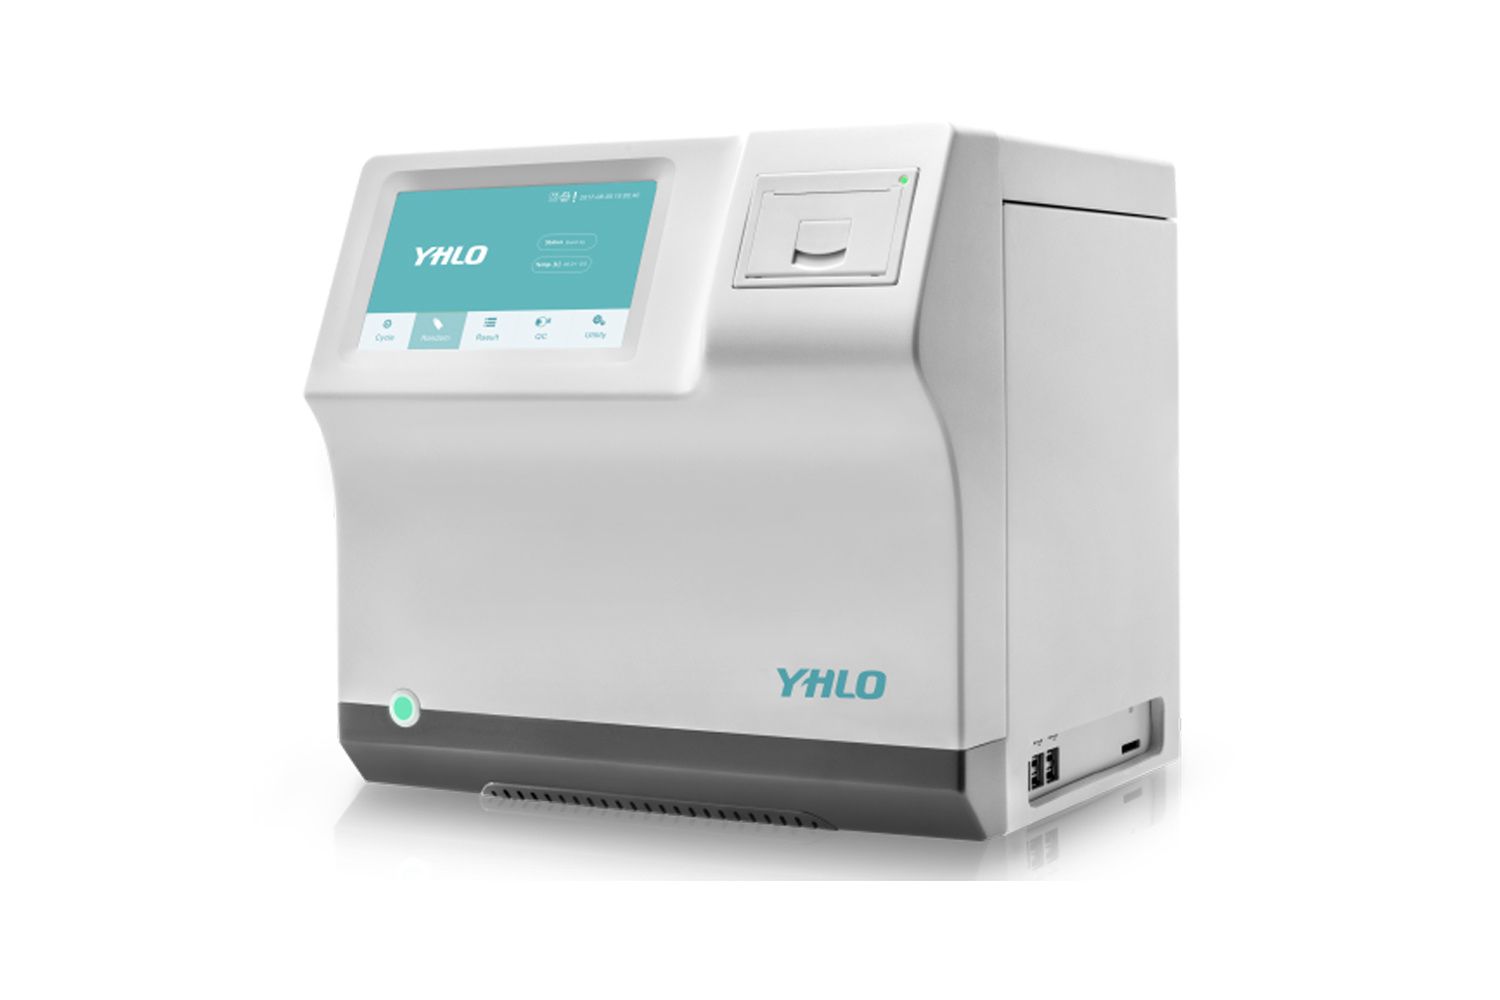
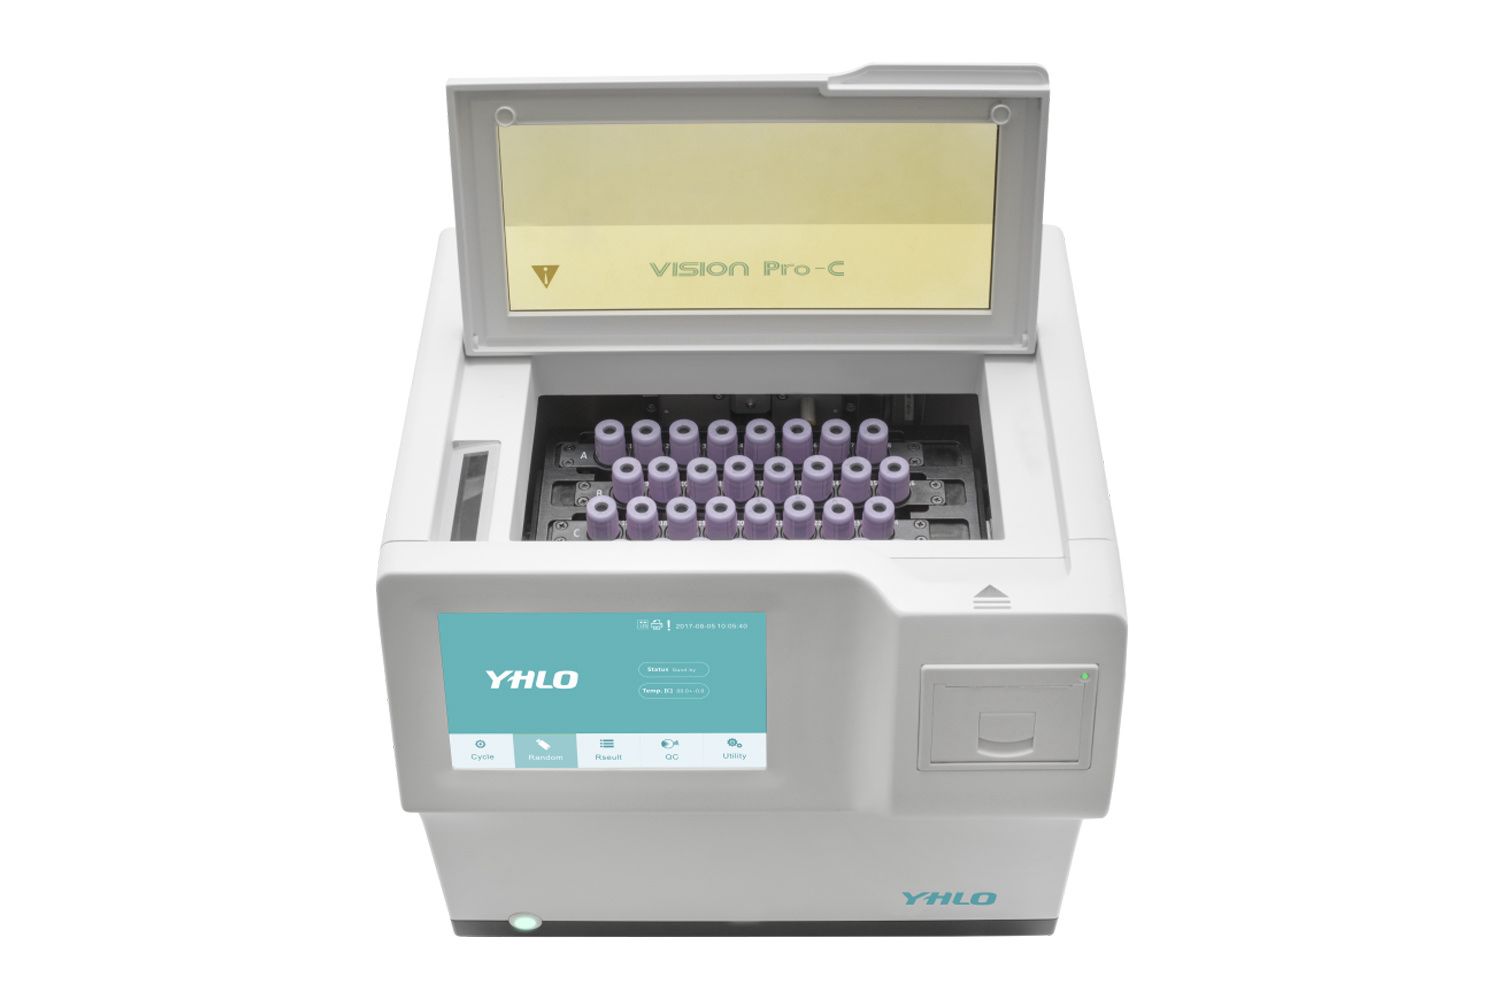
Characteristics of VISION & VISION Pro
| Item | VISION Pro | VISION |
| Model | VISION Pro-A (8 tubes)VISION Pro-B (16 tubes)VISION Pro-C (32 tubes) | VISION-A (8 tubes)VISION-B (16 tubes)VISION-C (32 tubes) |
| Screen | Internal LCD touch screen | External PC |
| Operating System | Linux system | Windows |
| Printer | Internal thermal printer | Supports external printer |
| Barcode Reader | Internal barcode scanner | Supports external barcode reader |
| LIS Communication | HL7 | TCP/IP |
| Language | Chinese, English, Turkish, Spanish | Chinese, English, Turkish, French, Italian |
| Test Dongle | VISION Pro Master DongleVISION Pro Secondary Dongle | VISION Master DongleVISION Secondary Dongle |
| Dimensions | 352 mm × 365 mm × 325 mm | 350 mm × 300 mm × 300 mm |
| Weight | 11.5 kg (Pro-A)12 kg (Pro-B)12.5 kg (Pro-C) | 8 kg (A)8.5 kg (B)9 kg (C) |
Dongle Design Table
| Dongle Type | Colour | Test Times |
| Master Dongle | Orange | 10,000 / 20,000 / 50,000 |
| Secondary Dongle | White | Blank |
There are 3 stages in erythrocyte sedimentation:
- Stage 1: Aggregation – rouleaux formation
- Stage 2: Sedimentation – settling stage
- Stage 3: Packing – sedimentation slows and cells start to pack at the bottom of the tube
The three stages spend 60 minutes in Westergren Method, while only 20 minutes in EDTA tubes.
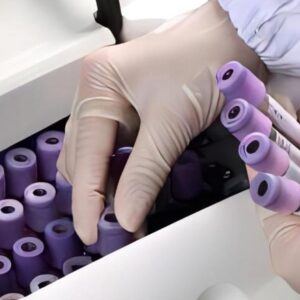
VISION ESR Analyzer series use primary EDTA tubes directly. The test principle is infrared emitting and receiving technology, which can monitor the real three stages and provide the dynamic sedimentation curve.
Note: There is a number of ESR systems claiming the possibility to provide the ESR result via the detection of the aggregation of red cells alone without measuring ESR. Obviously, aggregation
alone can’t present the whole ESR phenomenon.
Reviews
There are no reviews yet.